The QGIS Interface
QGIS provides an easy to use Graphical user interface (GUI) to explore, create and edit geospatial data. Commands and functions are activated using a combination of menu, toolbar and keyboard shortcut actions within the application.
This exercise will explore the basic interface of QGIS. You will create your first QGIS project, load various data layers, customize the appearance of your map using various data symbology and colors.
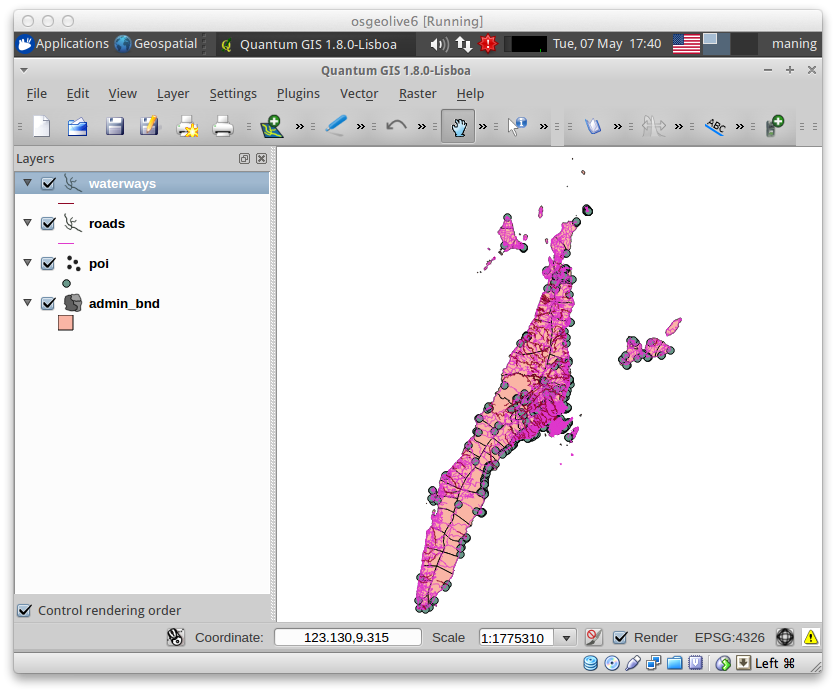
Interface Overview

- 1. Map Legend/Layers - where you add layers and interact with them, such as grouping them, setting symbology, and such.
- 2. Map View/Canvass - the main map area where the layers show up and all your visualization is done.
- 3. Tool Bar - button bars. Like most modern windows applications you can drag your button bars around and move them between layers. Hover over each button and you will get a short description of what it is for.
- 4. Menu Bar - most of the functionality in the Toolbar are up here as well. Don’t forget the all-important Help . QGIS has good documentation so use it.
- 5. Status Bar - shows status, coordinates and scale of the Map View. Sometimes map display updates also called rendering can be slow when using large data files. You can turn off rendering when dealing with large files until you want to see the layers.
Creating a new project
1. Launch QGIS in Windows by clicking Start ‣ All Programs ‣ Quantum GIS ‣ Quantum GIS.
2. Create a new project. File ‣  New Project.
3. Open the project properties. In the Menu, select Settings ‣ Project Properties.
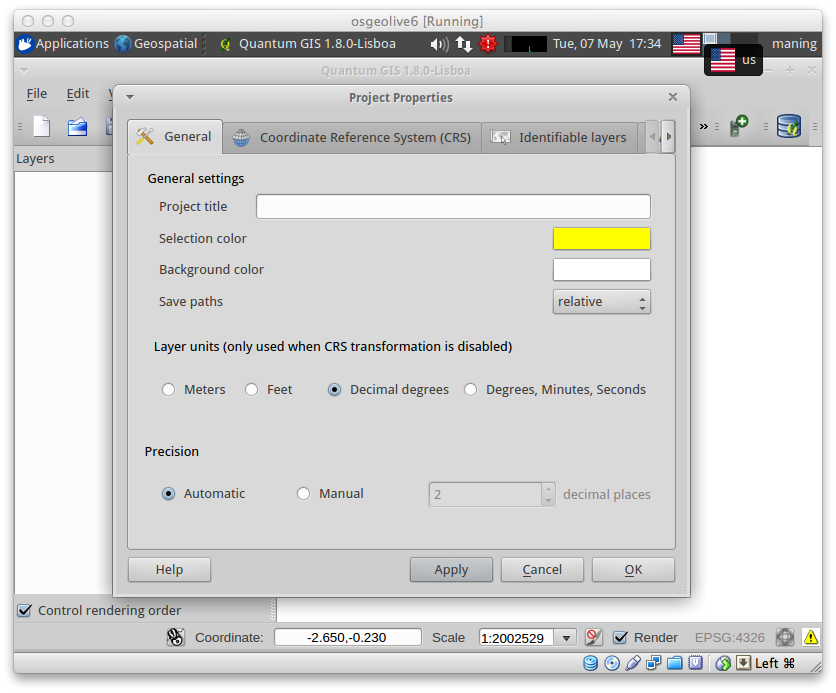
- In the General tab you can define the project title, selection and background color, layer units, precision, and the option to save relative paths to layers.
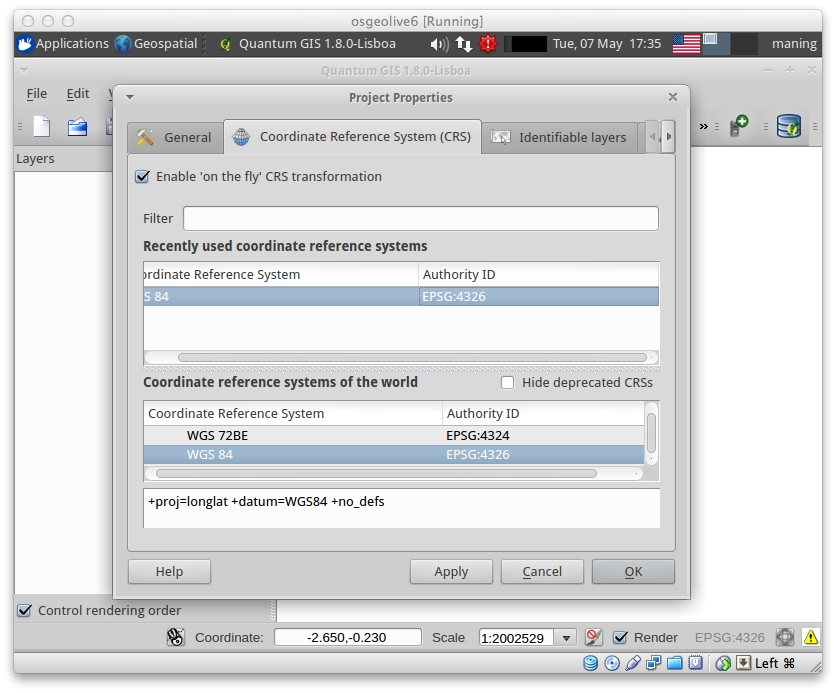
- The Coordinate Reference System (CRS) tab enables you to choose the CRS for this project, and to enable on-the-fly re-projection of layers when displaying layers from a different CRS.
- The Identifiable Layers tab you set (or disable) which layers will respond to the Identify tool.
4. Select the Coordinate Reference System (CRS) tab. Click the small triangle on the left side of the Geographic Coordinate System. This shows another list of CRS. Choose WGS 84. Click Apply then, OK.
Note
There is no need to set the CRS of the project if the layers to be loaded are of the same projection because QGIS will draw the coordinates using the data source. However, the On The Fly transformations needs to be enabled and the projection to be followed selected if the layers are of different projections.
Tip
Many GIS application opens any geospatial data (vector or raster) without asking for the coordinate referencing systems. QGIS follows a similar behavior. However, it is good practice to select the correct CRS whenever you start a new project. This habit can help you with problems in the future.
Opening Vector data
1. Add vector layers. In the Menu, select Layer ‣
 Add Vector Layer.
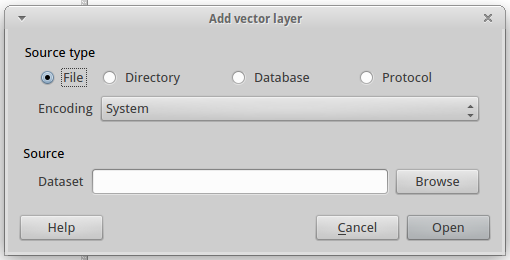
In the Source type, choose File. Click Browse and select your data/vector directory.
Select multiple vector layers by holding the Ctrl button of your keyboard while selecting files. Select the following files:
waterways.shp
poi.shp
roads.shp
admin_bnd.shp
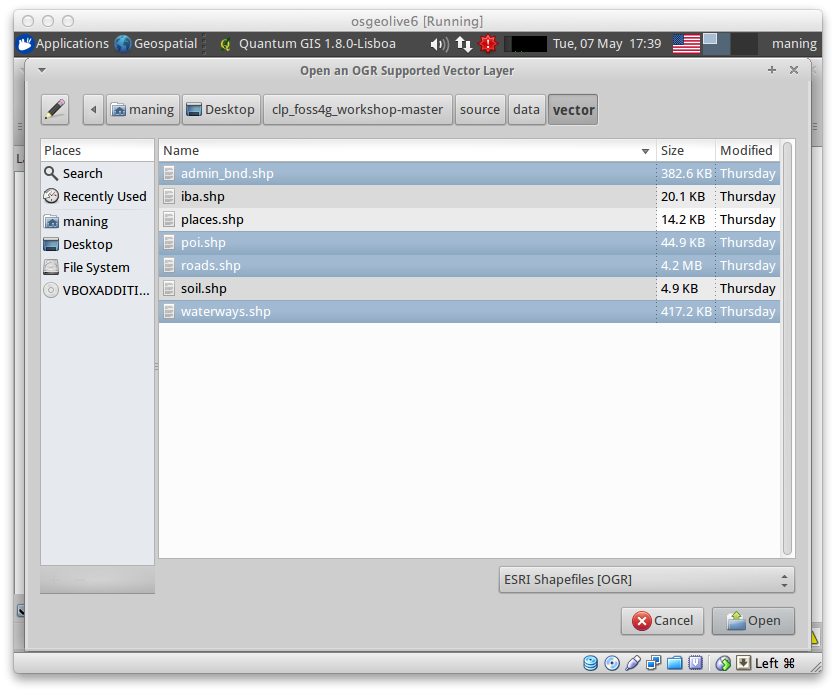
Once all the files are selected, Click Open. All vector layers will be loaded within your Map View area.
Vector data are represented as either point, line or polygon. The type of vector depends on what information you wish to convey.
- Points - represented by a single X,Y coordinate. A point normally represents a geographic feature that is too small to be displayed as a line or area. For example, oil wells and fire hydrants.
- Lines - A set of ordered coordinates that represent the shape of geographic features too narrow to be displayed as an area at the given scale or linear features with no area (county boundary lines). For example, railways, roads, rivers.
- Polygons - A feature used to represent areas. A polygon is defined by the lines that make up its boundary and a point inside its boundary for identification. Polygons have attributes that describe the geographic feature they represent. For example, forest stands, lakes.
2. Arrange the display order of layers by selecting a layer in the Map Legend and then drag to either above or below the other layers.

Arrange the data according to this list from top to bottom:
poi.shp
roads.shp
waterways.shp
admin_bnd.shp
Tip
Mapping standards suggest that points layers should be on top followed by lines and finally polygons.
Saving your project
1. In the File menu, select  Save Project. In the Name field, type:
myfirstqgisproject.qgs
2. Click Save. You have saved your first QGIS project.
A QGIS session is considered a Project. QGIS works on one project at a time. Settings are considered as being per-project or as a default for new projects. The kinds of information saved in a project file include:
- Layers added;
- Layer properties, including symbolization;
- Projection for the map view and;
- Last viewed extent.
Warning
The project file is saved in XML format (with a .qgs file extension), it is possible to edit the file outside QGIS if you know what you are doing.
Navigating around your map
Basic tools for navigating around the Map View involve the use of the zoom and pan functions. Each tool is explained below:
| Icon | Tool | Purpose |
|---|---|---|
 |
Pan | Interactively move the center of the map |
 |
Zoom In | Zoom in |
 |
Zoom Out | Zoom out |
 |
Zoom Full | Zooms to the full view of all the layers |
 |
Zoom to Layer | Zoom to the active or selected vector |
 |
Zoom to Selection | Zoom to the selected object within a vector layer |
 |
Zoom Last and Zoom Next | Goes back and forth to the previous zoom |
 |
Refresh | Redraw all data layers |
Zooming and panning with the mouse wheel. Press the mouse wheel to pan inside of the main window and you can roll the mouse wheel to zoom in and out. For zooming, place the mouse cursor inside the map area and roll it forward (away from you) to zoom in and backwards (towards you) to zoom out. The mouse cursor position will be the center of the zoomed area of interest.
Zooming and panning with the keyboard. Place the mouse cursor inside the map area and click on the right arrow key to pan east, left arrow key to pan west, up arrow key to pan north and down arrow key to pan south. The PgUp and PgDown keys on your keyboard will cause the map display to zoom in or out.
Tip
While you can do most navigation using the mouse, using the arrow keys on the keyboard for map navigation is very useful in many cases especially during digitizing.
Use the navigation tools to move in and around your map.
Changing the look of your layers
1. Changing vector layer properties like color and symbolization. Select the waterways layer and right-click on the layer and select Properties from the pop-up menu.
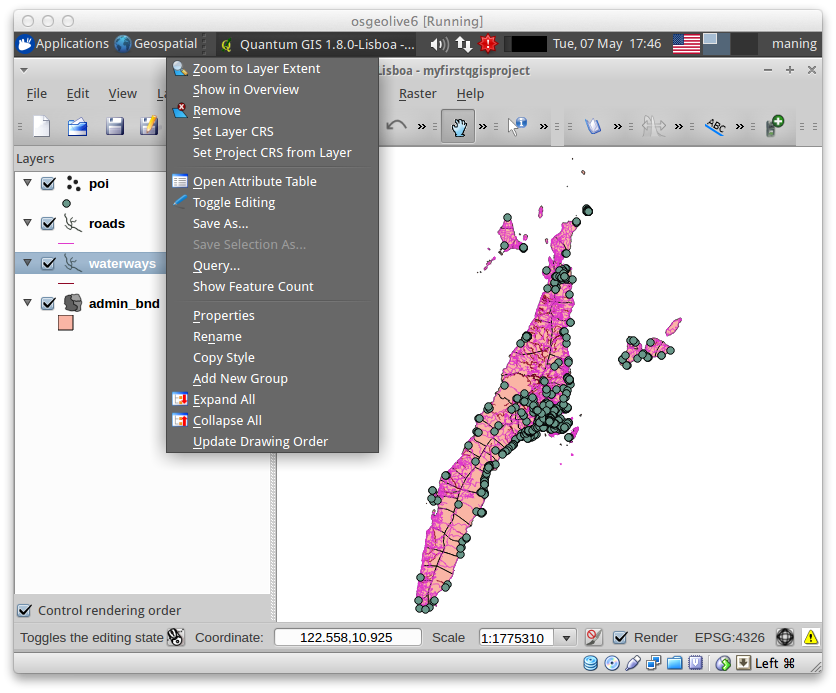
The Layer Properties dialog for a vector layer provides information about the layer, such as style settings and labeling options and other.
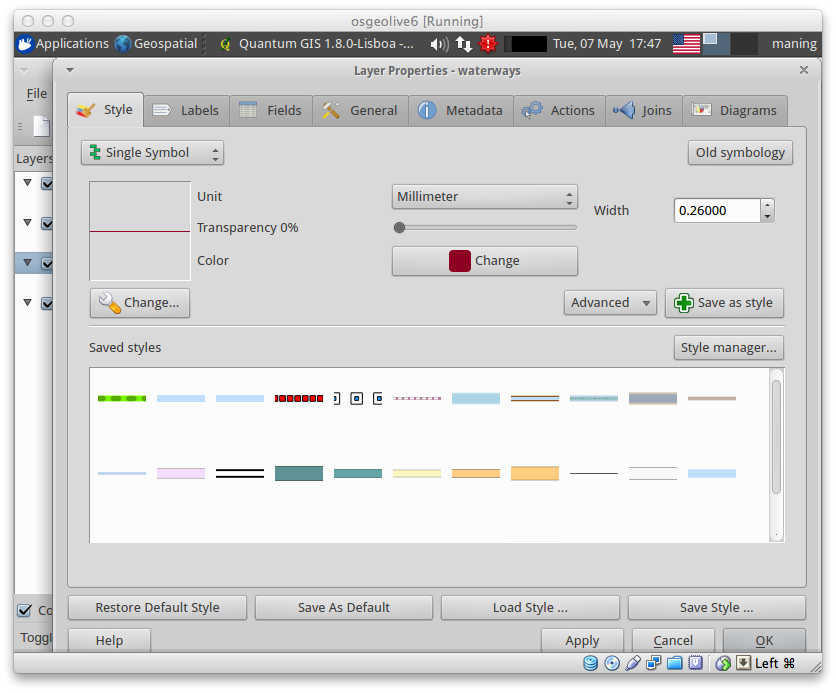
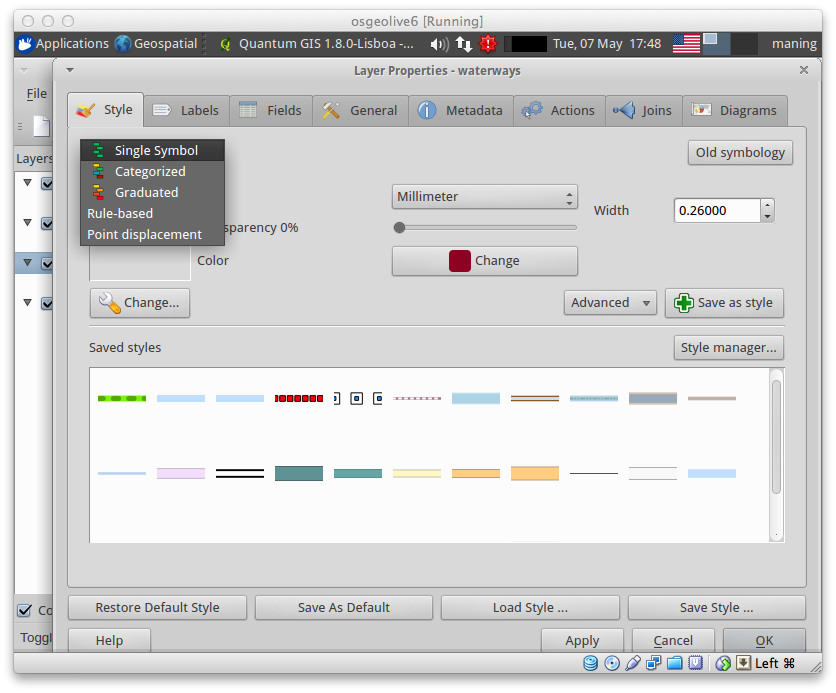
2. Select the Style tab. The Style tab provides you several ways to control how vector features are displayed. For this layer, we will change the line color. In the Legend type drop-down, select Single Symbol.
3. To access the the Symbol Properties dialog, click the
 Change.

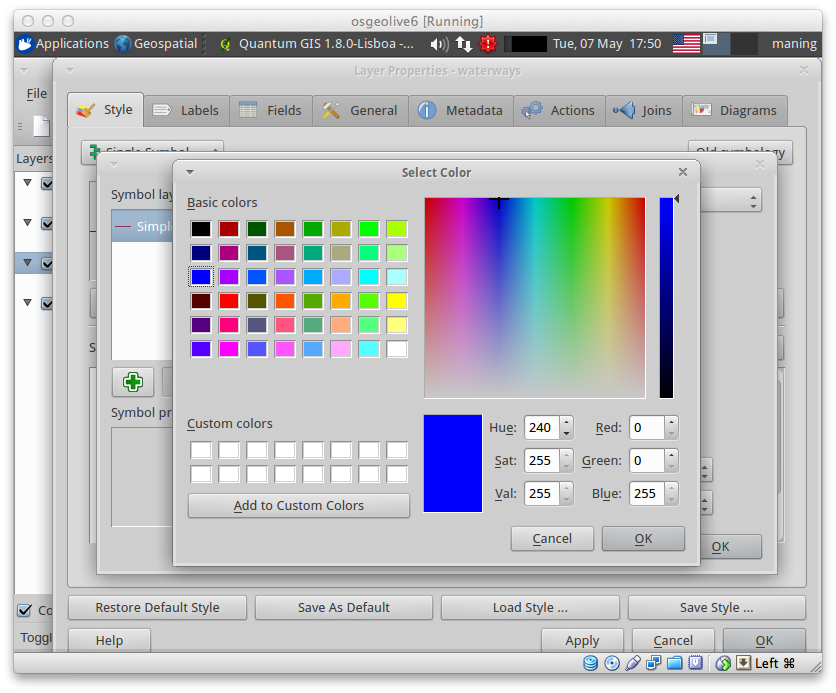
In the Symbol Properties dialog, click the Change button next to Color.
Another window showing the Select Color will then appear. Choose the color Blue or set the Red,Green, Blue (R:G:B) values to 0:0:255 respectively and click OK.
4. Select the General tab. This provides ways to change the display name, set scale dependent rendering options, create a spatial index of the vector file and view or change the projection of the specific vector layer. Change the Display name to Waterways.

5. Click Create Spatial Index. A spatial index will improve the speed of both zooming and panning. Spatial index used by QGIS have a .qix extension. Click Apply ‣ OK.
6. Repeat all the steps above to change layer properties of each vector layer.
7. Explore the other options of the vector properties. The Layer Properties provides several options to customize the look and feel of your layers. Use the other options until you’re satisfied with the look.
Try the following:
- Legend types
- Outline/Line options
- Fill options
- Different markers for points
- Transparency
Using custom styles
QGIS provides many features for styling and improving the look of your maps. The custom symbologies and scale-dependent rendering are possible for any vector type.
Note
There are three types of symbols: marker symbols (for points), line symbols (for lines) and fill and outline symbols (for polygons). Symbols can consist of one or more symbol layers. It is possible to define the color of a symbol and this color is then defined for all symbol layers. Some layers may have the color locked - for those the color can not be altered. This is useful when you define the color of a multilayer symbol. Similarly, it is possible to define the width for line symbols, as well as size and rotation for marker symbols.
More information is available in the QGIS User Guide.
For this exercise, we will use several pre-defined styles available in the data/styles directory.
1. Select the roads layer and right-click Properties.
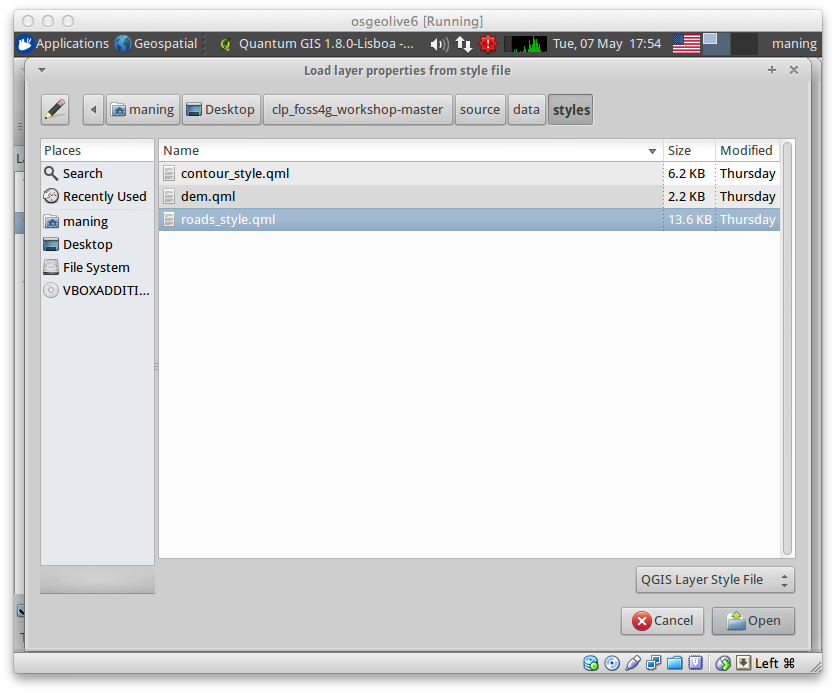
2. Within the Style tab of the roads layer, click Load Style .... Open your ~/data/styles directory and select roads_style.qml. Click Open.
3. The road layer is now using a rule-based style according to different road types. This custom style also uses the scale-dependent rendering. Click OK.
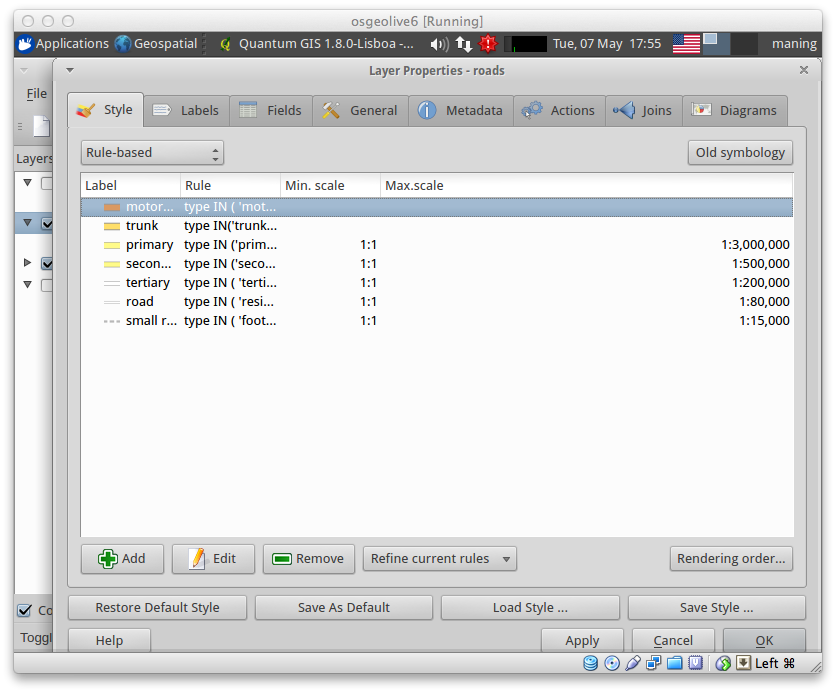
Tip
Scale dependent rendering allows you to set what features can be viewed at certain scale. This allows you to minimize “map clutter”. For example, in the roads layer, we set the scale for minor roads (tertiary, road, small road) to appear only on larger scales over the other road types.
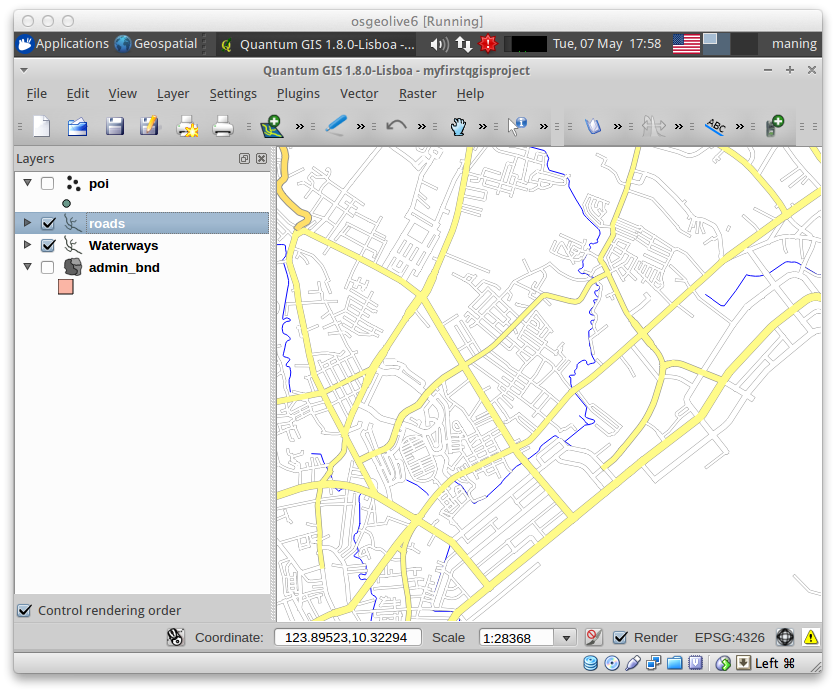
4. Zoom in and out of the Map view to see the scale-dependent rendering in action.
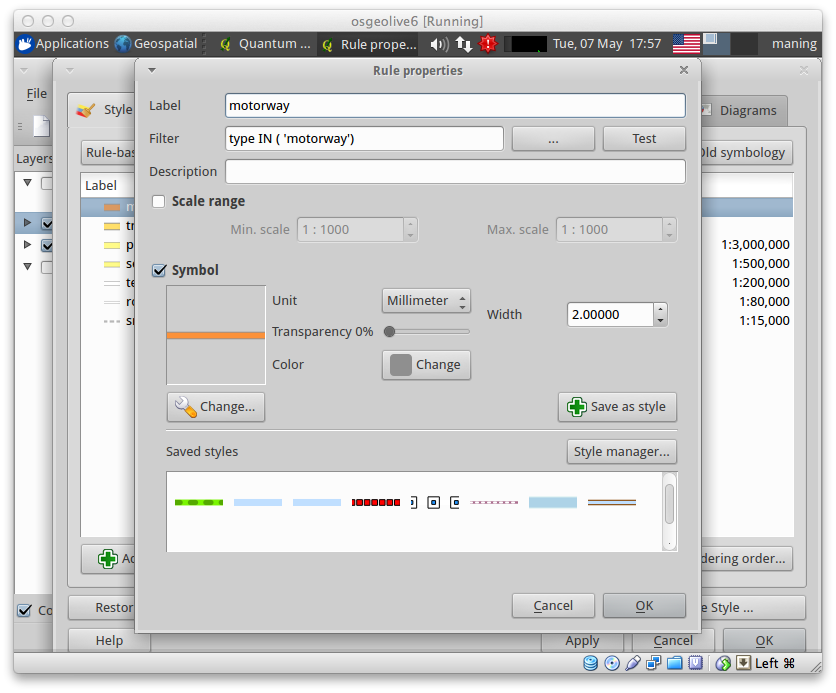
5. You can further customize the styles according to your preference by selecting any of the road style definition then, click Edit. This opens new window for the Rule properties.
5. Create custom styles for the other layers in your project.
Using the Labeling Tool
The Labeling tool provides smart labeling for vector point, line and polygon layers and only requires a few parameters.
Select the Roads layer. In the Menu, select
Layer ‣
 Labeling.

A new window will appear for the Layer labeling settings. Mark the following options shown in the screenshots below:
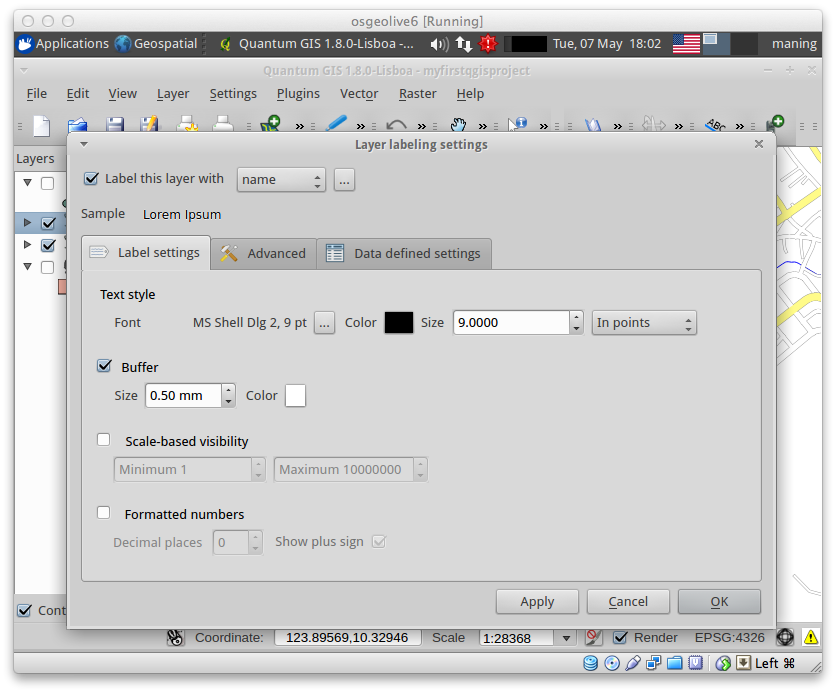
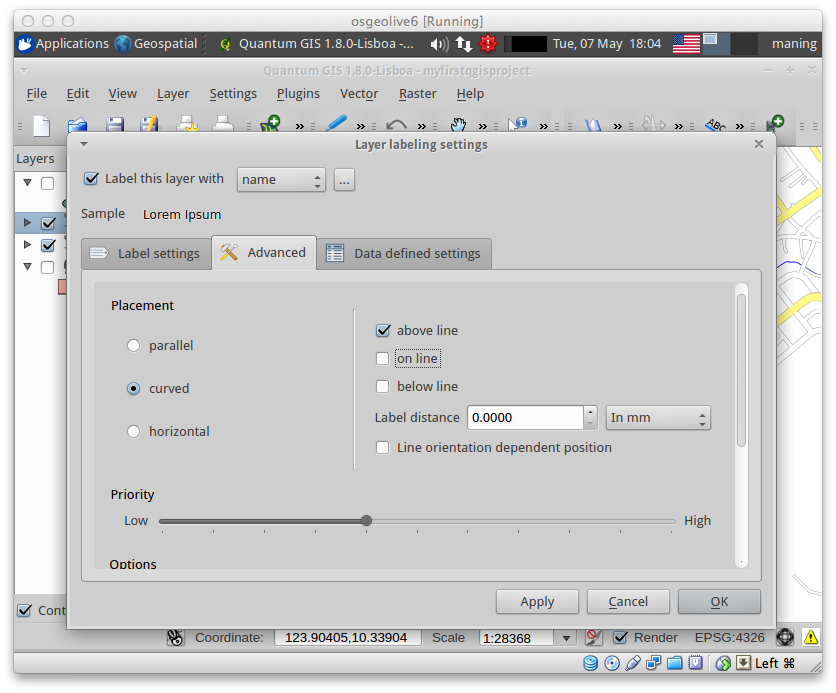
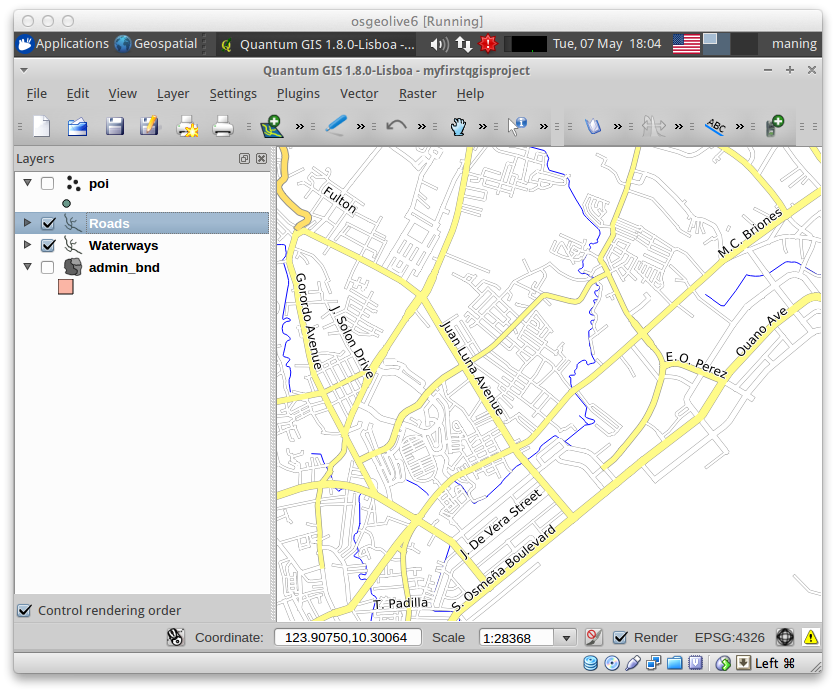
Select OK. The label for Roads should be placed above the road line. As you pan around the map, you’ll find that labels are placed nicely.
Other tips
Map Overview
The map overview panel provides a full extent view of layers added to it. Within this panel is a red box showing the current Map View extent. This allows you to quickly determine which area of the map you are currently viewing.
To activate the Map Overview, in the Menu, select View ‣ Panels ‣ Overview. A new panel will be added below the Map Legend (no map is displayed at the moment).
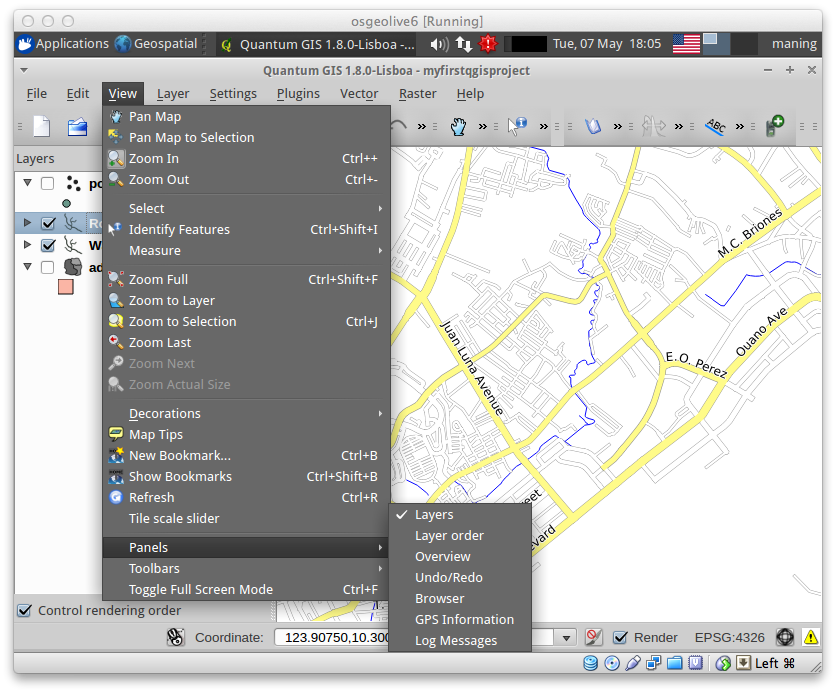
Select any layer, then right-click and select Show in Overview.
The selected layer should appear in the Overview panel.
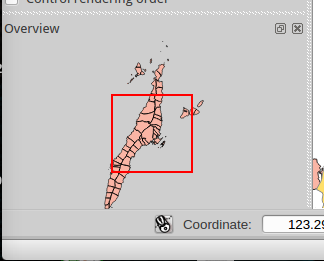
You can also add more layers or remove them. If you click and drag the red rectangle in the overview that shows your current extent, the main Map View will update accordingly.
Warning
Do not add too many layers into the Overview panel, this can slow down rendering of the overview map.
Line and Area Measurements
To interactively measure length and area, use the:
 Measure Line
 Measure Area
The tool then allows you to click points on the map. Each segment-length as well as the total shows up in the measure-window. To stop measuring click your right mouse button. Areas can also be measured. The accumulated area-size will be visible in the measure window.
Warning
Length and area results inherit the default projection and ellipsoid units! If you are using the Decimal Degrees (which is the case in our current project) as the layer units, the length and area results will be in decimal degrees as well.
Importing Image
In the Menu, select File ‣
 Save as image.
Select your preferred filename and image type. Click Save. You now have you first map image which you can add in any document or report.

Save your project
To save your project, select
File ‣
Save Project.
Tip
It is good practice to save your project after every major editing activity. Make sure you save your project frequently. Or better, practice the keyboard shortcut to save projects: Ctrl + S.
Table Of Contents
Previous topic
Next topic
Viewing and Editing Data Attributes