Viewing and Editing Data Attributes
Attributes for vector data are stored in a table. (In a Shapefile vector format, this is contained in a separate file with dbf extension). A table is like a spreadsheet. Each column in the table is called a field. Each row in the table is a record. Each of the records in the attribute table in a GIS corresponds to one feature. The application “links” the attribute records with the feature geometry so that you can find records in the table by selecting features on the map, and find features on the map by selecting features in the table. Each field in the attribute table contains contains a specific type of data such texts, numbers or date.
Viewing vector layer attributes
In QGIS you can easily view data attributes by either selecting the feature within the layer of interest or opening the full table.
1. To display the attribute table , select the admin_bnd
layer in Map Legend panel. In the Menu, select
View ‣  Identify Features.
Or just click the Identify Features in the
toolbar.
Identify Features.
Or just click the Identify Features in the
toolbar.
2. Click on any polygon in the map to show the feature attributes.
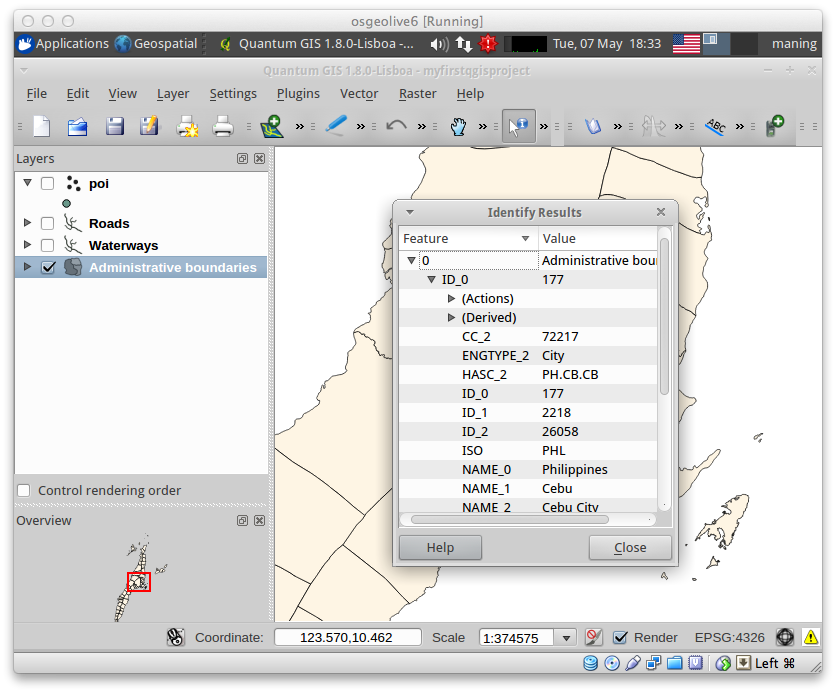
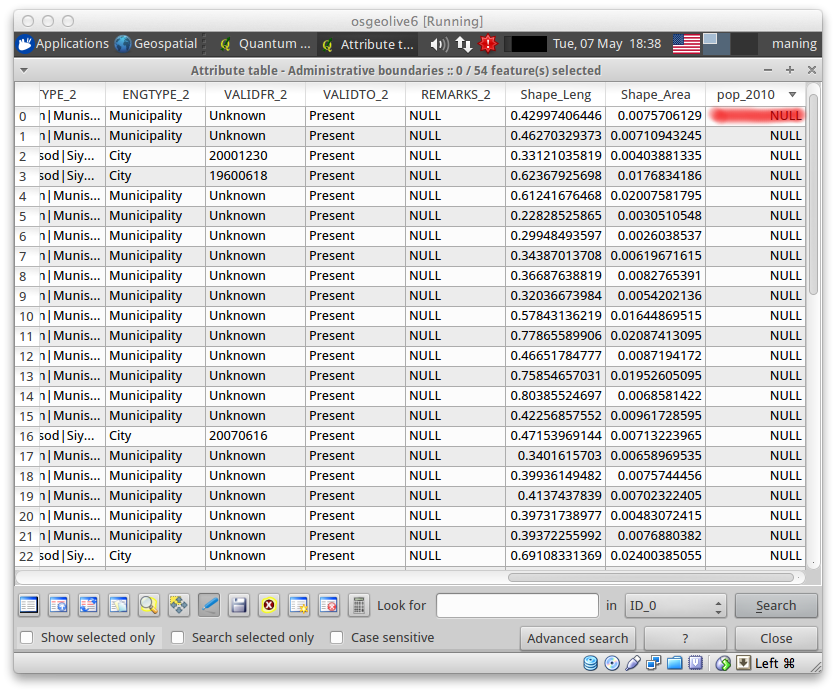
3. To view the attribute table similar to a spreadsheet, select the Administrative boundaries layer in the Map Legend. Right-click the layer and select Open Attribute Table.

4. A new window will appear showing the full table of the data layer. You can browse and edit the attribute table within this window.
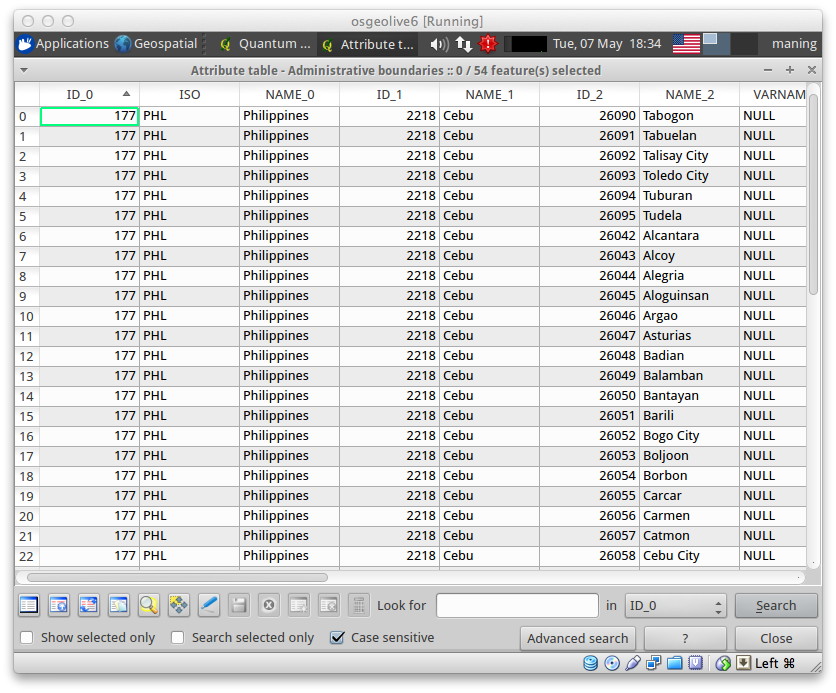
A full explanation of the tools within the Attribute table window is presented below:
| Icon | Tool | Purpose |
|---|---|---|
 |
Unselect All | Remove selection from previous selected records |
 |
Move Selection to Top | Move the selected records to the top of the table |
 |
Invert Selection | Invert selection |
 |
Copy Selected Rows | Copy selected rows to clipboard |
 |
Zoom Map to Selected Rows | Zoom map to selected rows |
 |
Toggle Editing Mode | Toggle editing mode to edit single values of attribute table and to enable functionalities described below. |
 |
Delete Selected Features | Delete selected features |
 |
New Column | Adds a new column in the attribute table. You will be asked to provide attribute details in a new window (name, field type, etc.). |
 |
Delete Column | Delete column |
 |
Open Field Calculator | Open field calculator to update attribute data based on arithmetic, logical and others |
Explore the different tools to understand how each one works.
Tip
Shapefile store attribute data in a separate file with a dbf extension. This is a widely used GIS database format. You can edit the dbf file outside QGIS using a spreadsheet application such as MS Office Excel and OpenOffice Calc, however, caution should be taken in order not to corrupt the files. Make sure you create a backup before editing the data outside QGIS.
Creating and editing attributes
We will update the admin_bnd layer by adding population for each polygon for the census year 2010.
1. Open the attribute table by selecting the Administrative boundaries layer in the Map Legend. Right-click the layer and select Open Attribute Table.
2. To enable editing the attribute table, click
the Toggle editing mode within the
Attribute table window.
3. Create a new attribute column by clicking the
New Column. A new dialog will appear.
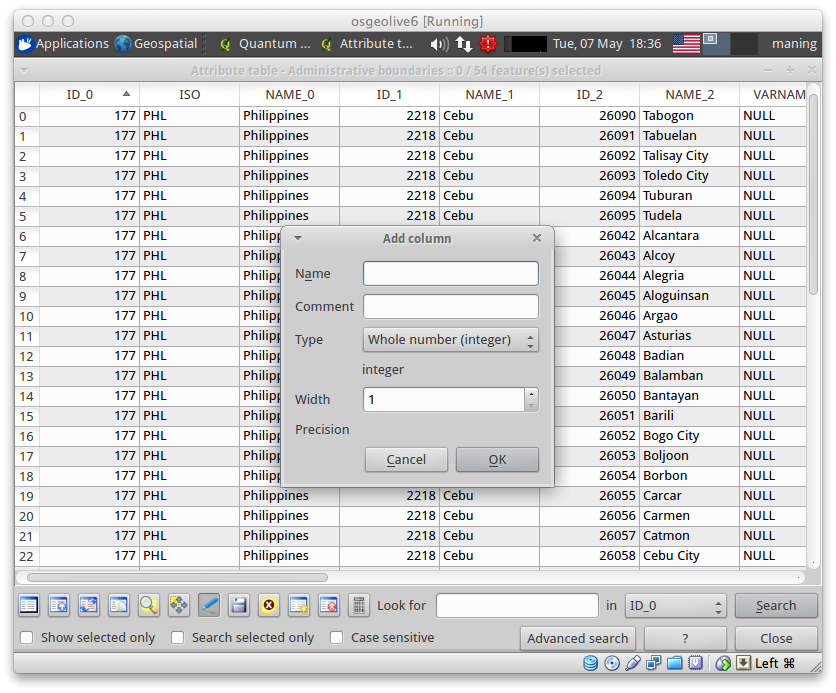
4. In the Name, type pop_2010. In the Type, select Whole number (integer). In the Width, type 10.
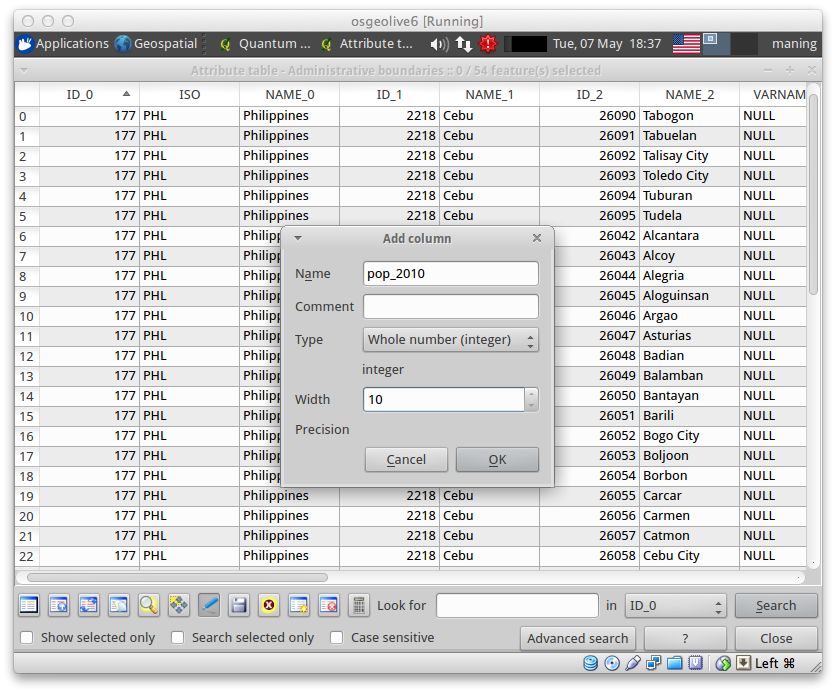
Click OK to add a new column in the attribute table.
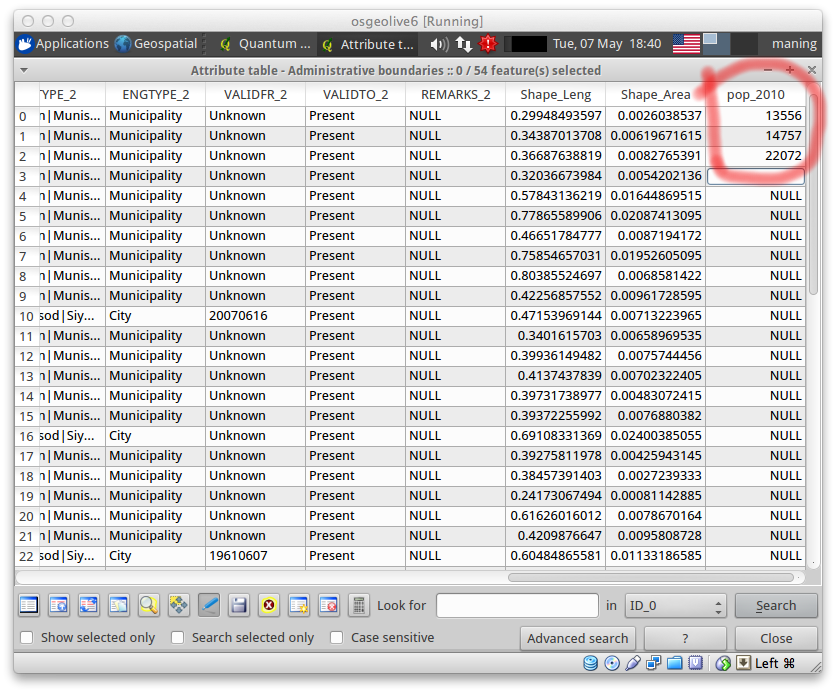
2. We will add the population data in the pop_2010 column. Start adding the population of each municipality following the table below:
Municipality    Population (2010)

Alcantara       13556
Alcoy           14757
Alegria         22072
Aloguinsan      27650
Argao           69503
Asturias        44732
Badian          37669
Balamban        71237
Bantayan        74785
Barili          65524
Bogo City       69911
Boljoon         15027
Borbon          31589
Carcar          107323
Carmen          44648
Catmon          28320
Cebu City       866171
Compostela      42574
Consolacion     106649
Cordoba         50353
Daanbantayan    74897
Dalaguete       63239
Danao City      119252
Dumanjug        46754
Ginatilan       15327
Lapu-Lapu City  350467
Liloan          100500
Madridejos      34905
Malabuyoc       18426
Mandaue City    331320
Medellin        50047
Minglanilla     113178
Moalboal        27676
Naga City       101571
Oslob           26116
Pilar           11564
Pinamungahan    57997
Poro            23498
Ronda           18582
Samboan         18613
San Fernando    60970
San Francisco   47357
San Remigio     51394
Santa Fe        27270
Santander       16105
Sibonga         43641
Sogod           30626
Tabogon         33024
Tabuelan        22292
Talisay City    200772
Toledo City     157078
Tuburan         58914
Tudela          9859


Source: National Statistics Office
        2010 Census of Population and Housing
        http://www.census.gov.ph/sites/default/files/attachments/hsd/pressrelease/Central%20Visayas.pdf
- Click again the Toggle editing mode to
save your edits.
Subset displayed data using table queries
QGIS can also limit the display of features to a subset of your data using attribute queries. It follows the standard Structured Query Language (SQL) used by other applications for managing databases. We will subset our data to display only the barangays within a specific district.
1. Select Administrative boundaries. Right-click and select Query...
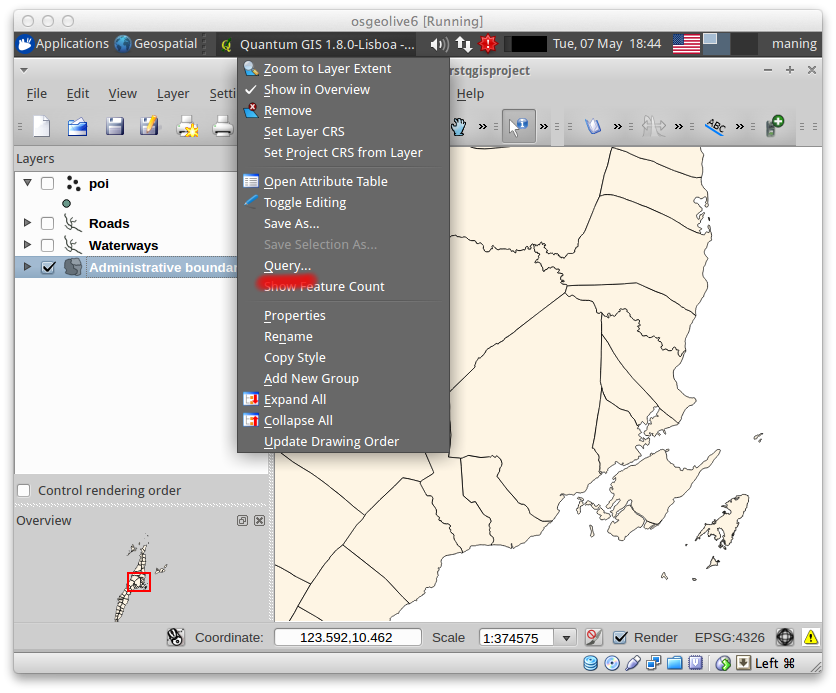
A new window Query Builder will appear.
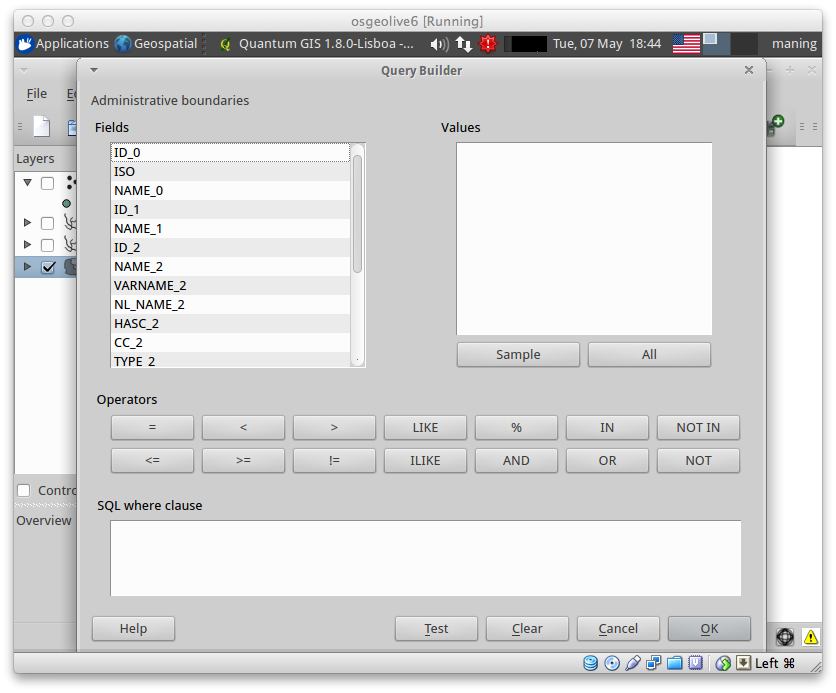
2. In the Query Builder, double-click NAME_2 in the Field section, then, click the = in the Operators section, then click the Sample in the Values section and finally, double-click Cebu City.
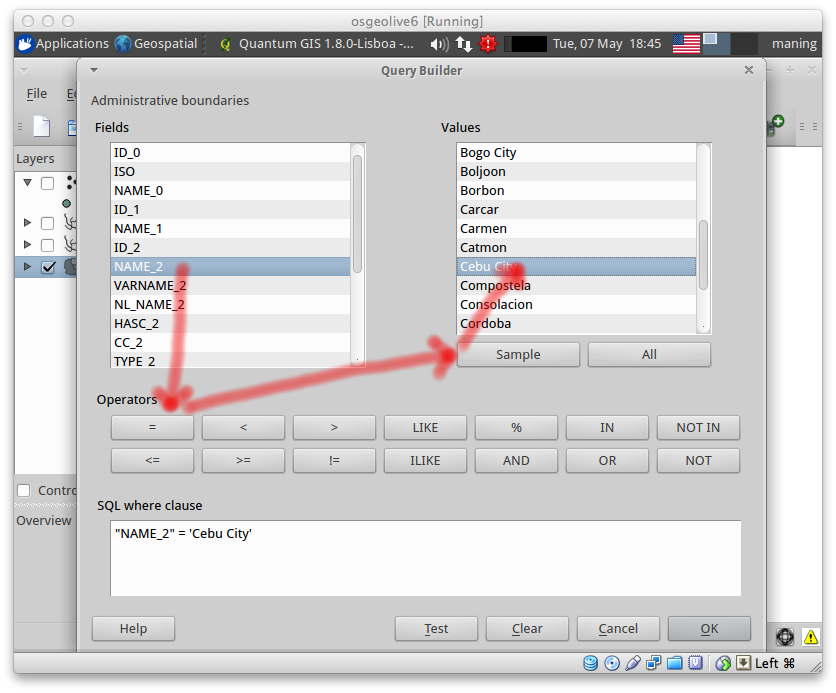
The result will be displayed in the SQL where clause text box as,
"NAME_2" = 'Cebu City'
This SQL simply means that within the NAME_2 attribute column, we will select and display only the polygon of Cebu City.
3. Click Test. If there are no errors in your SQL, click OK. The Administrative boundaries should show the subset of features in your Map View.
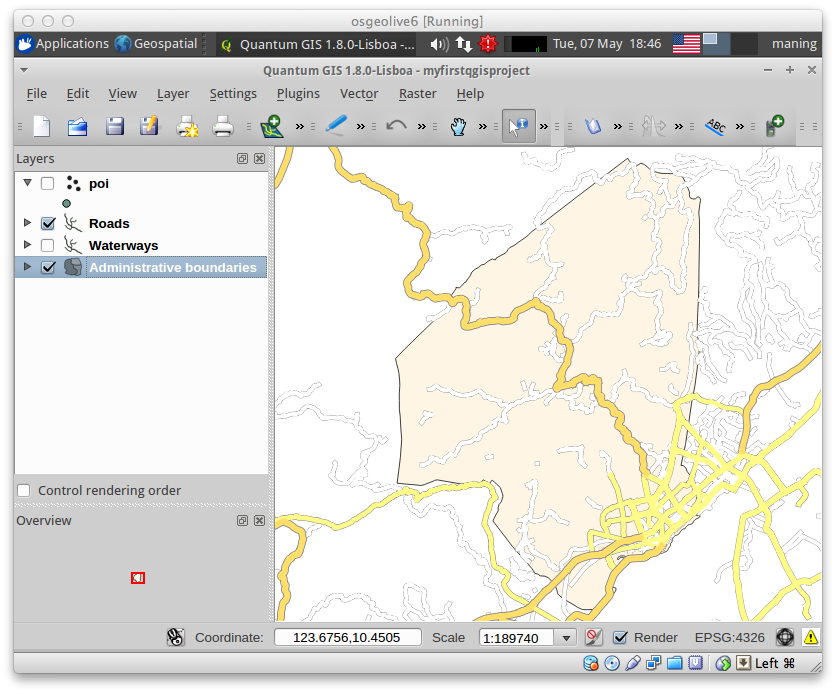
4. Remove the query and style your layer showing different colors base on the population.